Payrolls rose 22,000 in August, less than expected in further sign of hiring slowdown
Source: CNBC
Published Fri, Sep 5 2025 8:31 AM EDT Updated 4 Min Ago
Job creation sputtered in August, adding to recent signs of labor market weakening and likely keeping the Federal Reserve on track for a widely anticipated interest rate cut later this month.
Nonfarm payrolls increased by just 22,000 for the month, while the unemployment rate rose to 4.3%, according to a Bureau of Labor Statistics report Friday. Economists surveyed by Dow Jones had been looking for payrolls to rise by 75,000.
The report showed a marked slowdown from the July increase of 79,000, which was revised up by 6,000. Revisions also showed a net loss of 13,000 in June after the prior estimate was lowered by 27,000.

The report was the first since President Donald Trump fired former BLS Commissioner Erika McEntarfer following the release of the July jobs report a month ago. The move came after the report showed not just a weak level of job creation but also dramatic reductions in previous months’ totals.
Read more: https://www.cnbc.com/2025/09/05/jobs-report-august-2025.html
From the source -
Link to tweet
@BLS_gov
·
Follow
Both payroll employment (+22,000) and unemployment rate (4.3%) change little in August #BLSData https://bls.gov/news.release/empsit.nr0.htm
8:30 AM · Sep 5, 2025
And another first of the month Friday so stay tuned for DU's economic analysts with the deep dives.
Don't know if Lutnik will eat his hat for this remark or what -
Lutnick predicts 'better' job number accuracy after Trump fired BLS chief

Article updated.
Previous articles -
Job creation sputtered in August, adding to recent signs of labor market weakening and likely keeping the Federal Reserve on track for a widely anticipated interest rate cut later this month.
Nonfarm payrolls increased by just 22,000 for the month, while the unemployment rate rose to 4.3%, according to a Bureau of Labor Statistics report Friday. Economists surveyed by Dow Jones had been looking for payrolls to rise by 75,000.
The report showed a marked slowdown from the July increase of 79,000, which was revised up by 6,000. Revisions also showed a net loss of 13,000 in June after the prior estimate was lowered by 27,000.
The report was the first since President Donald Trump fired former BLS Commissioner Erika McEntarfer following the release of the July jobs report a month ago. The move came after the report showed not just a weak level of job creation but also dramatic reductions in previous months' totals.
Job creation sputtered in August, adding to recent signs of labor market weakening and likely keeping the Federal Reserve on track for a widely anticipated interest rate cut later this month.
Nonfarm payrolls increased by just 22,000 for the month, while the unemployment rate rose to 4.3%, according to a Bureau of Labor Statistics report Friday. Economists surveyed by Dow Jones had been looking for payrolls to rise by 75,000.
The report showed a marked slowdown from the July increase of 79,000, which was revised up by 6,000. Revisions also showed a net loss of 13,000 in June after the prior estimate was lowered by 27,000.
This is breaking news. Please refresh for updates.
Original article -
Nonfarm payrolls were expected to increase by 75,000 in August while the unemployment rate edged up tp 4.3%, according to the Dow Jones consensus estimate.
This is breaking news. Please refresh for updates.
 = new reply since forum marked as read
Highlight:
NoneDon't highlight anything
5 newestHighlight 5 most recent replies
= new reply since forum marked as read
Highlight:
NoneDon't highlight anything
5 newestHighlight 5 most recent replies

mahatmakanejeeves
(66,706 posts)Both total nonfarm payroll employment (+22,000) and the unemployment rate (4.3 percent) changed little in August. A job gain in health care was partially offset by losses in federal government and in mining, quarrying, and oil and gas extraction.
Employment Situation Summary
Transmission of material in this news release is embargoed until 8:30 a.m. (ET) Friday, September 5, 2025
Technical information:
Household data: (202) 691-6378 * cpsinfo@bls.gov * www.bls.gov/cps
Establishment data: (202) 691-6555 * cesinfo@bls.gov * www.bls.gov/ces
Media contact: (202) 691-5902 * PressOffice@bls.gov
THE EMPLOYMENT SITUATION -- AUGUST 2025
Total nonfarm payroll employment changed little in August (+22,000) and has shown little change since April, the U.S. Bureau of Labor Statistics (BLS) reported today. The unemployment rate, at 4.3 percent, also changed little in August. A job gain in health care was partially offset by losses in federal government and in mining, quarrying, and oil and gas extraction.
This news release presents statistics from two monthly surveys. The household survey measures labor force status, including unemployment, by demographic characteristics. The establishment survey measures nonfarm employment, hours, and earnings by industry. For more information about the concepts and statistical methodology used in these two surveys, see the Technical Note.
Household Survey Data
Both the unemployment rate, at 4.3 percent, and the number of unemployed people, at 7.4 million, changed little in August. These measures also changed little over the year. (See table A-1.)
Among the major worker groups, the unemployment rates for adult men (4.1 percent), adult women (3.8 percent), teenagers (13.9 percent), Whites (3.7 percent), Blacks (7.5 percent), Asians (3.6 percent), and Hispanics (5.3 percent) showed little or no change in August. (See tables A-1, A-2, and A-3.)
Among the unemployed, the number of new entrants decreased by 199,000 in August to 786,000, largely offsetting an increase in the prior month. New entrants are unemployed people who are looking for their first job. (See table A-11.)
The number of long-term unemployed (those jobless for 27 weeks or more) changed little at 1.9 million in August but has increased by 385,000 over the year. In August, the long-term unemployed accounted for 25.7 percent of all unemployed people. (See table A-12.)
In August, the labor force participation rate changed little at 62.3 percent, and the employment-population ratio was unchanged at 59.6 percent. Both measures have declined by 0.4 percentage point over the year. (See table A-1.)
The number of people employed part time for economic reasons, at 4.7 million, changed little in August. These individuals would have preferred full-time employment but were working part time because their hours had been reduced or they were unable to find full-time jobs. (See table A-8.)
The number of people not in the labor force who currently want a job, at 6.4 million, changed little in August but was up by 722,000 over the year. These individuals were not counted as unemployed because they were not actively looking for work during the 4 weeks preceding the survey or were unavailable to take a job. (See table A-1.)
Among those not in the labor force who wanted a job, the number of people marginally attached to the labor force changed little at 1.8 million in August. These individuals wanted and were available for work and had looked for a job sometime in the prior 12 months but had not looked for work in the 4 weeks preceding the survey. The number of discouraged workers, a subset of the marginally attached who believed that no jobs were available for them, also changed little over the month at 514,000. (See Summary table A.)
Establishment Survey Data
Total nonfarm payroll employment changed little in August (+22,000) and has shown little change since April. Over the month, a job gain in health care was partially offset by losses in federal government and in mining, quarrying, and oil and gas extraction. (See table B-1.)
In August, health care added 31,000 jobs, below the average monthly gain of 42,000 over the prior 12 months. Employment continued to trend up over the month in ambulatory health care services (+13,000), nursing and residential care facilities (+9,000), and hospitals (+9,000).
Employment in social assistance continued to trend up in August (+16,000), reflecting continued job growth in individual and family services (+16,000).
Federal government employment continued to decline in August (-15,000) and is down by 97,000 since reaching a peak in January. (Employees on paid leave or receiving ongoing severance pay are counted as employed in the establishment survey.)
In August, employment in mining, quarrying, and oil and gas extraction declined by 6,000, after changing little over the prior 12 months.
Wholesale trade employment continued to trend down in August (-12,000) and has fallen by 32,000 since May.
Manufacturing employment changed little in August (-12,000) but is down by 78,000 over the year. Employment in transportation equipment manufacturing declined by 15,000 over the month, in part due to strike activity.
Employment showed little change over the month in other major industries, including construction, retail trade, transportation and warehousing, information, financial activities, professional and business services, leisure and hospitality, and other services.
Average hourly earnings for all employees on private nonfarm payrolls rose by 10 cents, or 0.3 percent, to $36.53 in August. Over the past 12 months, average hourly earnings have increased by 3.7 percent. In August, average hourly earnings of private-sector production and nonsupervisory employees rose by 12 cents, or 0.4 percent, to $31.46. (See tables B-3 and B-8.)
In August, the average workweek for all employees on private nonfarm payrolls was 34.2 hours for the third month in a row. In manufacturing, the average workweek edged down to 40.0 hours, and overtime remained unchanged at 2.9 hours. The average workweek for production and nonsupervisory employees on private nonfarm payrolls was unchanged at 33.7 hours in August. (See tables B-2 and B-7.)
The change in total nonfarm payroll employment for June was revised down by 27,000, from +14,000 to -13,000, and the change for July was revised up by 6,000, from +73,000 to +79,000. With these revisions, employment in June and July combined is 21,000 lower than previously reported. (Monthly revisions result from additional reports received from businesses and government agencies since the last published estimates and from the recalculation of seasonal factors.)
_____________
The Employment Situation for September is scheduled to be released on Friday, October 3, 2025, at 8:30 a.m. (ET).
_________________________________________________________________________________________________
|
| 2025 Preliminary Benchmark Revision to Establishment Survey Data
| to be released on September 9, 2025
|
| Each year, the establishment survey estimates are benchmarked to comprehensive counts of
| employment from the Quarterly Census of Employment and Wages (QCEW) for the month of March.
| These counts are derived from state unemployment insurance (UI) tax records that nearly all
| employers are required to file. At 10:00 a.m. (ET) on September 9, 2025, BLS will release
| the preliminary estimate of the upcoming annual benchmark revision to the establishment
| survey data. This is the same day that the first-quarter 2025 data from QCEW will be issued.
|
| Official establishment survey estimates are not updated based on this preliminary benchmark
| revision. The final benchmark revision will be incorporated into official estimates with the
| publication of the January 2026 Employment Situation news release in February 2026.
|_________________________________________________________________________________________________
{snip}
* * * * *
Facilities for Sensory Impaired
Information from these releases will be made available to sensory impaired individuals upon request. Voice phone: 202-691-5200, Federal Relay Services: 1-800-877-8339.
-- -- -- -- -- --

bearsfootball516
(6,636 posts)Hoooooly shit, that is an atrocious report.

Bengus81
(9,388 posts)

relayerbob
(7,271 posts)The real ones are probably large negatives across the board.
Prairie Gates
(6,274 posts)

Johnny2X2X
(23,405 posts)Less than 30,000 a month.
I can remember when Joe Biden added 160,000 jobs in 1 month and got absolutely hammered by the corporate media because 250,000 had been expected.
I've been saying it here for years, but Joe Biden's economy was the last time working people will have had a chance to get ahead in my lifetime. That economy is long gone, get ready for a deep recession that devastates the working class.

Bernardo de La Paz
(58,398 posts)twodogsbarking
(15,775 posts)progree
(12,313 posts)Last edited Fri Sep 5, 2025, 09:42 AM - Edit history (1)
meaning we have just 1,000 more total nonfarm payroll jobs than were reported August 1. That's progress, I guess.
(June revised down by 27,000, and July revised up by 6,000)
Proof that this month's total non-farm employment is just 1,000 higher than in the August 1 report:
See post#11 and search for
"So compared to the report that came out one month ago "
Metaphorical
(2,520 posts)Revisions will likely take these numbers down even further, if ADP numbers are any indication.
I expect a slight uptick in September's numbers - typically this is the start of seasonal hiring for Christmas - but we'll probably be in net losses after the first of the year as the recession accelerates.
progree
(12,313 posts)from seasonal hiring, after their seasonal adjustments.
Coming up: a lot of federal workers that have accepted the "deferred resignation" and have been getting paid (and so are counted in the establishment survey) will lose their pay after September 30. But that's after the establishment survey's survey week, so we won't see that drop until the October report (released first Friday of November).
relayerbob
(7,271 posts)And tourism is way down. There’s going to be a lot less holiday hiring this year.
Bengus81
(9,388 posts)OnlinePoker
(6,022 posts)This was after a loss of 41,000 jobs in July.
https://www.ctvnews.ca/business/article/statistics-canada-to-release-august-labour-force-survey-today/

BumRushDaShow
(160,177 posts)only has a a population that is slightly larger than the state of California!
Bernardo de La Paz
(58,398 posts)Canada is taking a big hit now, but will recover sooner than the US. One thing I don't understand is why the Toronto Stock Exchange has been zooming for months in record territory outperforming the US market.
BumRushDaShow
(160,177 posts)of all the business coming there from the trade partners that we pissed off! 
Bernardo de La Paz
(58,398 posts)Lots of competition, but the net result is that the world is working around the US blockage, isolating US more and greatly reducing its soft power.
Soft power is a concept that mystifies the tRump regime. They don't understand it, so they have written it all off.
progree
(12,313 posts)Last edited Fri Sep 5, 2025, 08:18 PM - Edit history (2)
And yes, the monthly increases are net gains. The reported nonfarm payroll jobs increases are jobs created and job openings filled minus jobs lost: https://www.democraticunderground.com/10143221098#post24
AND SEASONALLY ADJUSTED - pretty much all the numbers you see reported in the media or BLS summary are the seasonally adjusted ones -- that certainly is true of the headline numbers -- nonfarm payroll jobs, unemployment rate -- as well as many others like the labor force participation rate. (I'm tired of seeing comments like the payroll jobs number is high this time because we're getting into the holiday hiring season, or low because we're done with the holiday season, or it's slow in August etc. Seasonal adjustments adjust for these seasonal cycles - that's why they are called seasonal adjustments)
BLS news release summary: https://bls.gov/news.release/empsit.nr0.htm
The headline payroll job numbers (+22,000 in AUGUST) come from the Establishment Survey
https://data.bls.gov/timeseries/CES0000000001
Monthly changes (in thousands): https://data.bls.gov/timeseries/CES0000000001?output_view=net_1mth
YEAR: JAN FEB MAR etc.
2022: 225 869 471 305 241 461 696 237 227 400 297 126
2023: 444 306 85 216 227 257 148 157 158 186 141 269
2024: 119 222 246 118 193 87 88 71 240 44 261 323
2025: 111 102 120 158 19 -13 79 22
The last 2 months (July and August) are preliminary, subject to revisions
Last 12 months: 122k/month average (27k/month average in last 4 months)
# Employed in thousands (up 288,000 in AUGUST) come from the separate Household Survey, http://data.bls.gov/timeseries/LNS12000000
Monthly changes (in thousands): http://data.bls.gov/timeseries/LNS12000000?output_view=net_1mth
If one adjusts the date range from 2021 to 2025, the graph is much more meaningful because it leaves out the huge swings of 2020 that greatly enlarges the Y axis and makes what follows look like tiny almost undiscernible squiggles around the zero axis
YEAR: JAN FEB MAR etc.
2022: 1016 483 608 --315 487 --284 164 477 75 --126 --177 752
2023: 958 178 417 162 --178 183 204 292 --33 --231 675 --762
2024: 66 --177 412 70 --331 --9 64 206 377 --346 --273 478
2025: 2234 --588 201 461 --696 93 --260 288
Last 12 months: 164k/month average ( Last 4 months: MINUS 144k/month average)
January and February of each year are affected by changes in population controls.
A very volatile data series from month to month. I used a double minus to make the negative ones stand out a little better
This Household Survey also produces the unemployment rate and labor force participation rate among many other stats
REVISIONS of the prior 2 months of Payroll Jobs: DOWN 21,000, from the BLS news release:
https://www.bls.gov/news.release/empsit.nr0.htm
So compared to the report that came out one month ago we have 22,000 - 21,000 = +1,000 net new payroll jobs reported.
The August 1 report's total nonfarm payroll employment: 159,539k
. . . https://www.bls.gov/news.release/archives/empsit_08012025.htm -- Table B-1
This (September 5 report's) total nonfarm payroll employment: 159,540k -- a 1k increase
. . . This month's: https://www.bls.gov/news.release/archives/empsit_09052025.htm or https://www.bls.gov/news.release/empsit.t17.htm or https://data.bls.gov/timeseries/CES0000000001
###############################################################
###############################################################
LINKS to some BLS Data Series Numbers and Graphs
Table A - Summary of Household Survey (produces unemployment rate, labor force participation rate) - https://www.bls.gov/news.release/empsit.a.htm
Table B - Summary of Establishment Survey (produces the headline payroll jobs number and the average earnings) - https://www.bls.gov/news.release/empsit.b.htm
Every one of these data series comes with a table and graph:
# Nonfarm Employment (Establishment Survey, https://data.bls.gov/timeseries/CES0000000001
Monthly changes (in thousands): https://data.bls.gov/timeseries/CES0000000001?output_view=net_1mth
NOT SEASONALLY ADJUSTED: https://data.bls.gov/timeseries/CEU0000000001
# Employed in thousands from the separate Household Survey, http://data.bls.gov/timeseries/LNS12000000
Monthly changes (in thousands): http://data.bls.gov/timeseries/LNS12000000?output_view=net_1mth
NOT SEASONALLY ADJUSTED: https://data.bls.gov/timeseries/LNU02000000
# Nonfarm PRIVATE Employment (Establishment Survey, https://data.bls.gov/timeseries/CES0500000001
Monthly changes: https://data.bls.gov/timeseries/CES0500000001?output_view=net_1mth
^-Good for comparison to the ADP report that typically comes out a few days earlier
NOT SEASONALLY ADJUSTED: https://data.bls.gov/timeseries/CEU0500000001
Earnings of Production and Non-Supervisor Workers (PANSW)
. . . # INFLATION ADJUSTED Hourly Earnings of PANSW http://data.bls.gov/timeseries/CES0500000032
. . . # INFLATION ADJUSTED Weekly Earnings of PANSW http://data.bls.gov/timeseries/CES0500000031
----- Nominal means NOT inflation adjusted. Just plain ordinary greenbacks ----
. . . # Nominal Hourly Earnings of PANSW- http://data.bls.gov/timeseries/CES0500000008
. . . # Nominal Weekly Earnings of PANSW - http://data.bls.gov/timeseries/CES0500000030
# Labor Force http://data.bls.gov/timeseries/LNS11000000?output_view=net_1mth
The labor force is the sum of employed and unemployed. To count as unemployed, one must have actively sought work in the past 4 weeks (just looking at want ads and job postings doesn't count)
# ETPR (Employment-To-Population Ratio) aka Employment Rate http://data.bls.gov/timeseries/LNS12300000
# LFPR (Labor Force Participation rate) http://data.bls.gov/timeseries/LNS11300000
Unemployed, Unemployment Rate
# Unemployed http://data.bls.gov/timeseries/LNS13000000
# Unemployment rate http://data.bls.gov/timeseries/LNS14000000
# Black unemployment rate (%), https://data.bls.gov/timeseries/LNS14000006
# Hispanic or Latino unemployment rate (%), https://data.bls.gov/timeseries/LNS14000009
# White unemployment rate (%), https://data.bls.gov/timeseries/LNS14000003
# U-6 unemployment rate http://data.bls.gov/timeseries/LNS13327709
# Long term unemployed 27 weeks or longer as a percent of total unemployed http://data.bls.gov/timeseries/LNS13025703
------------ end unemployed, unemployment rates --------
# NILF -- Not in Labor Force http://data.bls.gov/timeseries/LNS15000000
# NILF-WJ -- Not in Labor Force, Wants Job http://data.bls.gov/timeseries/LNS15026639
# Part-Time Workers who want Full-Time Jobs (Table A-8's Part-Time For Economic Reasons) http://data.bls.gov/timeseries/LNS12032194
# Part-Time Workers (Table A-9) http://data.bls.gov/timeseries/LNS12600000
# Full-Time Workers (Table A-9) http://data.bls.gov/timeseries/LNS12500000
# Multiple Job holders (Table A-9) - http://data.bls.gov/timeseries/LNS12026619
# Multiple Jobholders as a Percent of Employed (Table A-9) https://data.bls.gov/timeseries/LNS12026620
# Civilian non-institutional population
Seasonally adjusted (they seem to have gotten rid of this) https://data.bls.gov/timeseries/LNS10000000
NOT seasonally adjusted: https://data.bls.gov/timeseries/LNU00000000
. . In Table A-1 https://www.bls.gov/news.release/empsit.t01.htm they show the same numbers for seasonally adjusted and non-seasonally adjusted
LFPR - Labor Force Participation Rate for some age groups
The LFPR is the Employed + jobless people who have looked for work in the last 4 weeks (and say they want a job and are able to take one if offered. Looking for work involves more than just looking at job listings). All divided by the civilian non-institutional population age 16+ (in the case of the regular LFPR, or divided by the civilian non-institutional population of whatever age, gender, race etc. for the various sub-demographic measures. For example. the LFPR of age 25-54 females is the number of those employed or actively seeking work divided by the civilian non-institutional population of age 25-54 females.)
SA means Seasonally adjusted. NSA means Not Seasonally Adjusted
16+: SA: http://data.bls.gov/timeseries/LNS11300000 NSA: http://data.bls.gov/timeseries/LNU01300000
25-34: SA: http://data.bls.gov/timeseries/LNS11300089 NSA: http://data.bls.gov/timeseries/LNU01300089
25-54 ("Prime Age" ): SA: http://data.bls.gov/timeseries/LNS11300060 NSA: http://data.bls.gov/timeseries/LNU01300060
. . . . . . Prime Age Men: SA: http://data.bls.gov/timeseries/LNS11300061
. . . . . . . . . . . .From Jan 1960 to Jan 2025, Prime Age Men LFPR went from 97.1% to 89.4%. That means that the percent not in the labor force went from 2.9% to 10.6%, a 3.7 fold increase in this proportion.
. . . . . . Prime Age Women: SA: http://data.bls.gov/timeseries/LNS11300062
55-64: -------------------- NSA: https://data.bls.gov/timeseries/LNU01300095
55+: SA: http://data.bls.gov/timeseries/LNS11324230 NSA: http://data.bls.gov/timeseries/LNU01324230
65+: SA: ---------------- NSA: http://data.bls.gov/timeseries/LNU01300097
LFPR - Labor Force Particpation Rate (prime age 25-54) by gender
All: http://data.bls.gov/timeseries/LNS11300060
Men: http://data.bls.gov/timeseries/LNS11300061
Women: http://data.bls.gov/timeseries/LNS11300062
Labor force level (thousands) age 25-54 ("Prime Age" ) http://data.bls.gov/timeseries/LNS11000060
More LFPR links including by race: https://www.democraticunderground.com/111695870
ETPR - Employment to Population Ratio for some age groups
SA means Seasonally adjusted. NSA means Not Seasonally Adjusted
16+: SA: http://data.bls.gov/timeseries/LNS12300000 NSA: http://data.bls.gov/timeseries/LNU02300000
25-34: http://data.bls.gov/timeseries/LNS12300089 NSA: http://data.bls.gov/timeseries/LNU02300089
25-54 ("Prime Age" ): SA: http://data.bls.gov/timeseries/LNS12300060 NSA: http://data.bls.gov/timeseries/LNU02300060
55-64: SA: ---------------- NSA: https://data.bls.gov/timeseries/LNU02300095
55+: SA: http://data.bls.gov/timeseries/LNS12324230 NSA: http://data.bls.gov/timeseries/LNU02324230
65+: SA: ---------------- NSA: http://data.bls.gov/timeseries/LNU02300097
Data series finder (employment/unemployment related): https://www.bls.gov/data/#employment
The entire report: http://www.bls.gov/news.release/pdf/empsit.pdf
Inflation rate (CPI)
. . . Monthly report: https://www.bls.gov/news.release/cpi.nr0.htm
. . . Regular CPI: https://data.bls.gov/timeseries/CUSR0000SA0?output_view=pct_1mth
. . . Core CPI: http://data.bls.gov/timeseries/CUSR0000SA0L1E?output_view=pct_1mth
. . . Energy: https://data.bls.gov/timeseries/CUSR0000SA0E?output_view=pct_1mth
. . . Food: https://data.bls.gov/timeseries/CUSR0000SAF1?output_view=pct_1mth
. . . Food at home (groceries): https://data.bls.gov/timeseries/CUSR0000SAF11?output_view=pct_1mth
. . . Calculator at: https://www.bls.gov/data/inflation_calculator.htm
. . . One Screen Data Search for CPI components: https://data.bls.gov/PDQWeb/cu
Grocery prices (food at home) inflation compared to overall inflation rate
. . . . . https://www.in2013dollars.com/Food-at-home/price-inflation
. . . From 1947 to 2021 and from 2000 to 2021, food at home inflation very slightly lagged the overall inflation rate
. . . . . https://www.democraticunderground.com/10142735789
Archives of previous reports - The monthly payroll employment reports from the BLS are archived at Archived News Releases (https://www.bls.gov/bls/news-release/ ). In the list up at the top, under Major Economic Indicators, select Employment Situation ( https://www.bls.gov/bls/news-release/empsit.htm ). That opens up links to reports going back to 1994.

IronLionZion
(49,903 posts)and put in someone who will report BIGLY numbers that he likes?
MAGA is creating jobs in a negative downward direction. True greatness comes from becoming unemployed and being paid less. Job creators can find efficiencies through AI. So we need to give big tax cuts to billionaires so they can create jobs for nonhuman bots that will trickle down to the rest of us in imaginary ways.

Wiz Imp
(7,141 posts)There is not currently a BLS Commissioner and the commissioner has no involvement in the calculation of the jobs numbers anyway (which is what makes Trump's firing of the commissioner so stupid and outrageous).
it remains to be seen how Trump reacts to this report. Maybe he tries to fire everyone at BLS? Maybe he tries to simply dissolve BLS? The courts would block either action. Maybe he just wait for his new commissioner nominee to be confirmed and leave it up to him? The career staff at BLS will never go along with falsifying the data, so stopping publishing the data seems the most likely course of action.
Prairie Gates
(6,274 posts)Though monthly releases are apparently required by statute.
Of course, since when has Trumpism ever been held to statutory requirements?
Wiz Imp
(7,141 posts)And Trump hasn't signaled he agreed with stopping the monthly reports yet either. Trump's reaction today should be interesting.
IronLionZion
(49,903 posts)Prairie Gates
(6,274 posts)IronLionZion
(49,903 posts)He'll prescribe you to swim in raw sewage and get brain worms
Prairie Gates
(6,274 posts)mcar
(45,330 posts)
progree
(12,313 posts)"Near term, the Fed is likely to prioritize labor market stability over its inflation mandate, even as inflation drifts further from the 2% target. Four straight months of manufacturing job losses stand out. It’s hard to argue that tariff uncertainty isn’t a key driver of this weakness."

Lemon Lyman
(1,504 posts)If only more of them had voted for Kamala Harris (those who voted wrong AND those who neglected to vote at all).
We had a good thing going.
Response to Lemon Lyman (Reply #20)
Wiz Imp This message was self-deleted by its author.

BoRaGard
(7,538 posts)by having the proles work their asses off...and slopping up the gop tax cuts for the wealthy
truthisfreedom
(23,468 posts)Unless project 2025 is dismantled and made as illegal as nazism.
Wiz Imp
(7,141 posts)She also lied and her attempted spin was so weak as to be pathetic.
https://www.cnn.com/business/live-news/us-jobs-report-august-2025
Trump’s labor secretary blames Powell for jobs report, says numbers ‘underperformed just a bit’
“Well 22,000 jobs underperformed just a bit, but it’s still in the positive, almost a half a million jobs have been created since the President took office,” she said.
Asked if tariffs have anything to do with the slowing job market, Chavez de Remer said, “Tariffs are working.”
“How do I know this? Because companies are reinvesting in the American workforce. We’re seeing the consumer confidence up. We’re seeing real wages up year over year, almost 4% real wages are up,” she said.
Jobs are up by almost 500,000 (+487,000) since January but that represents extremely weak growth. As a comparison during the previous 7 months (The final 7 months of Biden's term) job growth was 1,138,000. Over Biden's entire Presidency, we averaged +336,000 jobs a month. Under Trump so far? +70,000. Even if you just include the period after jobs surpassed their pre-pandemic peak, Biden's average was 216,000.
She's says consumer Confidence is up, but that is false. There are 2 measures of Consumer Confidence. The Conference Board's Consumer Confidence Index and the University of Michigan Index of Consumer Sentiment. Both showed a spike in June, but both have declined since then and both are down since January (beginning of Trump's term) and over-the-year.
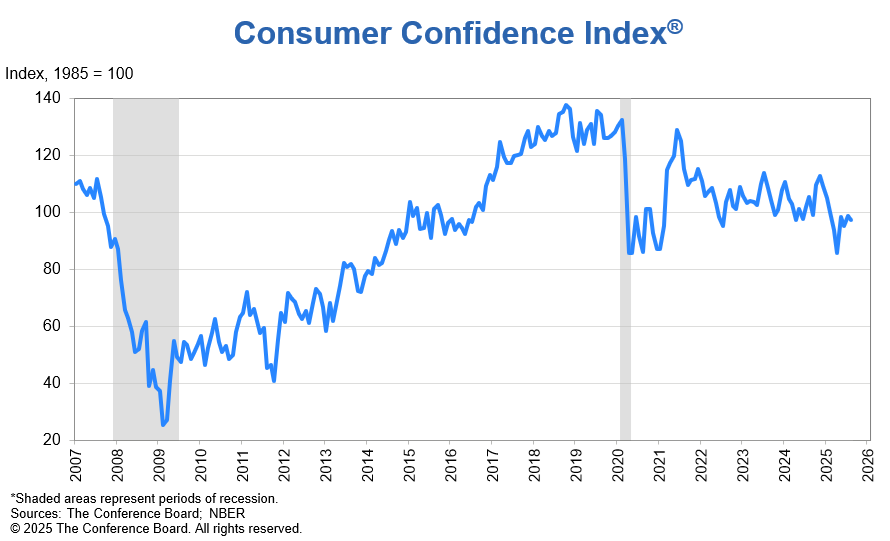
https://www.conference-board.org/topics/consumer-confidence/
DATE OF SURVEY INDEX OF CONSUMER SENTIMENT
August 2024 67.9
September 2024 70.1
October 2024 70.5
November 2024 71.8
December 2024 74.0
January 2025 71.7
February 2025 64.7
March 2025 57.0
April 2025 52.2
May 2025 52.2
June 2025 60.7
July 2025 61.7
August 2025 58.2
https://www.sca.isr.umich.edu/
She also said real wages were up 4% year over year. According to BLS the true year-over-year increase is only 1.2% for hourly earnings and 1.4% for weekly earnings.
https://www.bls.gov/news.release/realer.t01.htm
progree
(12,313 posts)
Including your table of numbers since graph is hard to read as far as which month things occurred --
DATE OF SURVEY INDEX OF CONSUMER SENTIMENT
August 2024 67.9
September 2024 70.1
October 2024 70.5
November 2024 71.8
December 2024 74.0
January 2025 71.7
February 2025 64.7
March 2025 57.0
April 2025 52.2
May 2025 52.2
June 2025 60.7
July 2025 61.7
August 2025 58.2
https://www.sca.isr.umich.edu/
Thanks also for the info on real (i.e. inflation-adjusted) average and weekly hourly earnings.
travelingthrulife
(3,251 posts)republianmushroom
(21,375 posts)or just republican economics ?

riversedge
(77,782 posts)
SunSeeker
(56,673 posts)My poor son, who is graduating in June of next year, is so screwed.
LetMyPeopleVote
(169,809 posts)As MSNBC’s Ali Velshi summarized, “Turns out firing the ref doesn’t change the score.”
The question for the White House is simple: “If Trump has created a ‘hot’ economy, why has American job growth slowed to a 16-year low?†www.msnbc.com/rachel-maddo...
— Steve Benen (@stevebenen.com) 2025-09-05T13:07:38.074Z
https://www.msnbc.com/rachel-maddow-show/maddowblog/us-job-growth-turns-ugly-summer-trumps-economic-agenda-falters-rcna229286
Job creation sputtered in August, adding to recent signs of labor market weakening and likely keeping the Federal Reserve on track for a widely anticipated interest rate cut later this month. Nonfarm payrolls increased by just 22,000 for the month, while the unemployment rate rose to 4.3%, according to a Bureau of Labor Statistics report Friday.
While the data from August was ugly, just as important were the revisions from June and July, which were down a combined 21,000 jobs compared with earlier, preliminary reporting. This included a rare negative month: The revisions showed the economy lost 13,000 in June.......
But as MSNBC’s Ali Velshi summarized, “Turns out firing the ref doesn’t change the score.”
Over the first eight months of 2025, the latest data suggests the economy has added 598,000 jobs. That might sound like a decent number, but over the first eight months of 2024 — when Trump said the economy was terrible — the total was over 1.1 million jobs, and over the first eight months of 2023, the U.S. economy added more than 1.8 million jobs.
In fact, if we exclude 2020, when the pandemic wreaked havoc on the economy, the first eight months of this year show the slowest job growth in the U.S. since 2009, when the economy was still hemorrhaging jobs from the Great Recession.
When trying to boast about the economy, the White House routinely references what it calls the “Trump Effect.” The latest job data, coupled with sluggish growth and stubborn inflation, suggests this “effect” simply isn’t working.
Indeed, the question the president and his team ought to face is simple: “If Trump has created a ‘hot’ economy, why has American job growth slowed to a 16-year low?”
Bluetus
(1,544 posts)Tariffs are forcing inflation through the roof. Interest cots don't help that. They make it worse.
And a big part of the slowdown is lack of labor as the immigration policies are terrorizing millions of people who did essential jobs in this country, especially agriculture. We have only begun to see the leading edge effects of these terrible policies. There is nothing in the FED's bag of tricks that can fix what Trump has broken.

Trueblue Texan
(3,750 posts)Do they mean jobs? What are the units the 22,000 refers to?
BumRushDaShow
(160,177 posts)
relayerbob
(7,271 posts)These numbers are fudged, and that we lost jobs.