U.S. payroll growth totals 177,000 in April, topping expectations
Source: CNBC
Published Fri, May 2 2025 8:30 AM EDT Updated 10 Min Ago
Job growth was stronger than expected in April despite worries over the impact of President Donald Trump's blanket tariffs against U.S. trading partners.
Nonfarm payrolls increased a seasonally adjusted 177,000 for the month, slightly below the downwardly revised 185,000 in March but above the Dow Jones estimate for 133,000, the Bureau of Labor Statistics reported Friday.

The unemployment rate, however, held at 4.2%, as expected, indicating that the labor market is holding relatively stable. The survey of households, which is used to calculate the jobless rate, showed an even stronger gain, with an increase of 436,000 in those who reported holding jobs on the month.
A broader unemployment gauge that includes discouraged workers and those holding part-time jobs for economic reasons, or the underemployed, edged lower to 7.8%. The labor force participation rate edged higher to 62.6%.
Read more: https://www.cnbc.com/2025/05/02/jobs-report-april-2025.html
From the source -
Link to tweet
@BLS_gov
·
Follow
Payroll employment rises by 177,000 in April; unemployment rate unchanged at 4.2% https://bls.gov/news.release/empsit.nr0.htm
#JobsReport #BLSdata
8:31 AM · May 2, 2025
Good morning all and TGIF. Please stay tuned for DU's economy analyzers to add the deep dive data.
Article updated.
Previous article -
Job growth was stronger than expected in April despite worries over the impact of President Donald Trump's blanket tariffs against U.S. trading partners.
Nonfarm payrolls increased a seasonally adjusted 177,000 for the month, slightly below the downwardly revised 185,000 in March but above the Dow Jones estimate for 133,000, the Bureau of Labor Statistics reported Friday.
The unemployment rate, however, held at 4.2%, as expected., indicating that the labor market is holding relatively stable.
This is breaking news. Please refresh for updates.
Original article -
Nonfarm payrolls were expected to increase by 133,000 in April, according to the Dow Jones consensus estimate.
This is breaking news. Please refresh for updates.
 = new reply since forum marked as read
Highlight:
NoneDon't highlight anything
5 newestHighlight 5 most recent replies
= new reply since forum marked as read
Highlight:
NoneDon't highlight anything
5 newestHighlight 5 most recent replies

OrlandoDem2
(2,762 posts)A bad report would’ve put pressure on the Fed to lower rates. What will this do?

BumRushDaShow
(151,641 posts)until at least after June (there was a whole set of feds expected to be laid off June 1st).
The Fed is still looking at "inflation" and the effects of the tariffs are going to impact that. But they haven't been in effect long enough due to being put off and put off until now, and even with that, having some "big ticket item" (cars) exceptions.
mathematic
(1,564 posts)Shorter term rates (under 1 year) strongly depend on market expectations for the Fed's rates. As a result, you can determine what the market predicts the federal funds rate to be.
They're now giving a 40% chance of a june cut, while yesterday it was at 55%.
Two cuts by july decreased from 45% to 30%. One cut by july increased from 44% to 55%.
The end of year prediction is always a bit fuzzy but it shifted it's most likely scenario to 3 cuts from 4 cuts. It's a small shift.

NoMoreRepugs
(11,263 posts)
gab13by13
(27,888 posts)Are these real numbers or DOGE numbers?
One thing that Krasnov has succeeded in doing is to sow distrust in government, his government.
yardwork
(66,426 posts)
Bengus81
(8,738 posts)These tariffs and the effects aren't going to come into play for months. Give it months with 145% tariffs and Canada boycotting the US and something will have to give...and it will.
Reagan was in office for over a year before he all but wiped out my floor covering biz. The aviation industry was next but was more into 1984 or so and it DIED here in Wichita.
progree
(11,853 posts)I found this, FWIW:
https://finance.yahoo.com/news/april-jobs-report-shows-us-labor-market-remained-resilient-in-wake-of-liberation-day-tariff-announcement-123204519.html
"People count towards payrolls as long as they did any work in their employer's pay period which includes the 12th of the month," Tombs added.
"Nearly three-quarters of employees are paid either biweekly, semimonthly or monthly, so they would still count on April payrolls even if employers moved quickly to cut jobs after the April 2 tariff announcements. What's more, we already know from the low level of initial jobless claims in recent weeks that employers have not rushed to fire staff."
And this from the BLS: https://bls.gov/news.release/empsit.nr0.htm
yardwork
(66,426 posts)Self Esteem
(2,097 posts)We live in a post-truth reality on both sides where neither side believes anything anymore.
Biden stole the 2020 election.
Trump stole the 2024 election.
The Fed purposely kept rates high to hurt Biden.
The Fed is purposely keeping rates high to hurt Trump.
Biden cooked the job numbers.
Trump is cooking the jobs numbers.
Cheezoholic
(2,891 posts)Trump stole the election in 2024? seriously? I think most understand this not to be true. 2020 only because that sides where crazy lives.
There were many, even on here, who wanted hell fire to come down on Powell for not lowering rates but the hard core financials were just getting to a point where the Fed would lower them right at the time of the election. Most economists agreed. Inflation, while falling and now rising, wasn't quite where the Fed traditionally likes it to lower rates. I honestly believe Powell did a decent job and is continuing to do a decent job even though I don't particularly like the Federal Reserve system.
Once again Biden cooking the job numbers comes from the side of crazy.
It is well known that Biden kept many institutional leaders, including Powell, from the previous administration in their jobs. That kind of transparency helps to alleviate accusations of false numbers and distrust in government amongst RATIONAL people.
The question of whether we can trust the numbers TODAY coming out of various govt departments isn't crazy at all. First of all Krasnov fired EVERYBODY. More than any other president and replaced them with self centered billionaire ass kissers. Its well documented. Not some crazy conspiracy. If you watched that disgusting North Korean style cabinet ass kissing fest  cabinet meeting the fact that this administration will fudge the books is a given. Once again, that's not conspiracy, thats common sense.
Creating distrust in government is a cornerstone of the Federalist Society Heritage Foundation Conservative philosophy to encapsulate power into the hands of the few. While sometimes foolish Democrats fall into that trap, our party has had the trowel of democracy in our hands for over 100 years constantly trying to rebuild the foundation and trust the people so desperately need.
gab13by13
(27,888 posts)Cheezoholic
(2,891 posts)
Johnny2X2X
(22,807 posts)Their methods are transparent. And there have been no rumors of DOGE gutting them yet.
We'll know when they start to cook these numbers, but there's no signs of that yet.

Wiz Imp
(4,852 posts)i can say that the jobs numbers for the entire history of the program (like 85 years) until now have always been 100% honest. There has never been any political influence causing BLS to manipulate the numbers.
That said, it is understandable why people are concerned that may finally change with this administration. However, there is absolutely ZERO evidence of any data manipulation by BLS to this point. All evidence points to the data still being honest. To be clear, the numbers are not nearly as good as they may first appear. March job totals were revised downward by 43000 and February by 15000 for a total of 58000 fewer jobs than previously reported. If you remove those from the reported April gains, you find that the April Number is only 119,000 above the previously reported March level. That is in fact below projections.
Now there is one part of this jobs report that I do believe is highly questionable. Federal Government jobs were down very slightly and are only down a total of 26000 since January. The administration has made a big deal out of cutting hundreds of thousands of Federal jobs. So why aren't they showing up in the total jobs numbers yet? Having experience with how the Government reports their jobs for this survey program, a slight delay in them showing up in the jobs report is believable. However, I would expect a significantly larger drop to have been reported by now. The Federal jobs numbers are reported to BLS by OPM. Is it possible OPM is purposely delaying showing the drop in Federal employment to BLS? I have no proof that is happening, but there is definite reason for suspicion.
Johnny2X2X
(22,807 posts)But he takes more and more owenrship with these better than expected reports. Of course, much of the media will go along with whatever he says, but a portion of the population won't, and more and more people are blaming Trump for ruining the great Biden economy.
I believew that we'll see UE over 5% by mid Summer and there will be clear job losses, that's when we should look for Trump to raid the BLS.
mahatmakanejeeves
(64,512 posts)administrative leave. In that category, they are counted as working and not unemployed. Not yet at least.
Wiz Imp
(4,852 posts)The point of getting rid of these people is to save money so why would they continue paying them to do nothing? (I know that is happening with some of the "fired" workers, but it in no way accounts for most of workers who have been fired.
Second, regulations only permit administrative leave for 10 work days per year.
Administrative leave is permitted—at an agency's discretion but subject to statutory and regulatory requirements—when an agency determines that no other paid leave is available under other law. Under section 6329a(b)(1), an agency “may place” an employee on administrative leave for no more than 10 total workdays in any given calendar year.
It appears this is being ignored.
This CNN article from late March had identified over 120,000 workers laid off and in their methodologies they explicitly state:
https://www.cnn.com/politics/tracking-federal-workforce-firings-dg
So that is 120,000 jobs lost without including anyone placed on admin leave.
I trust BLS. I DO NOT trust OMB or OPM at this point. I am very skeptical that they are being honest with the public in terms of what is happening/has happened with Federal workers being terminated.
mahatmakanejeeves
(64,512 posts)Efficiency!
Federal Workers Get Second ‘Fork in the Road’ Buyout Offer (2)
For Fork in the Road, Part 2, the offers were not coming from OPM:
Being at a phone and not on a real computer, I haven’t been through the entire text of the report. A glance at parts shows the usual dry BLS boilerplate. This is a good thing. It suggests that the staff at BLS has not been hijacked, and that they are the same people who have been doing this all along.
The channel 4 weatherman says that rain is really coming down at Montgomery Mall.
And good afternoon.

Rebl2
(16,225 posts)area of the country we are starting to see some layoffs and small businesses concerned (because of tariffs) they may have to close their stores.
rurallib
(63,672 posts)I am surprised it wasn't 258,000,000 but Bondi already used that number
Fullduplexxx
(8,453 posts)
angrychair
(10,571 posts)How can we trust the BLS to be honest anymore?
In my opinion these numbers are bullshit trying to hide from reality.

MichMan
(15,041 posts)progree
(11,853 posts)Last edited Fri May 2, 2025, 03:51 PM - Edit history (1)
jobs compared to the total number reported a month ago (April 4).
Yes, these are net gains. The reported nonfarm payroll jobs are jobs created and job openings filled minus jobs lost: https://www.democraticunderground.com/10143221098#post24
Maybe the SPITR types (Smartest People In The Room types) can dig in and find the inconsistencies. Rather than just posting that every good economic report is Krasnov manipulation, and every bad economic report is proof that the economy is falling apart.
The headline payroll job numbers (177,000 in April come from the Establishment Survey
https://data.bls.gov/timeseries/CES0000000001
Monthly changes (in thousands): https://data.bls.gov/timeseries/CES0000000001?output_view=net_1mth
YEAR: JAN FEB MAR etc.
2022: 225 869 471 305 241 461 696 237 227 400 297 126
2023: 444 306 85 216 227 257 148 157 158 186 141 269
2024: 119 222 246 118 193 87 88 71 240 44 261 323
2025: 111 102 185 177
The last 2 months (Mar and Apr) are preliminary, subject to revisions
Last 12 months: 157k/month average
# Employed in thousands (up 436,000 in April) come from the separate Household Survey, http://data.bls.gov/timeseries/LNS12000000
Monthly changes (in thousands): http://data.bls.gov/timeseries/LNS12000000?output_view=net_1mth
If one adjusts the date range from 2021 to 2025, the graph is much more meaningful because it leaves out the huge swings of 2020 that greatly enlarges the Y axis and makes what follows look like tiny almost undiscernible squiggles around the zero axis
YEAR: JAN FEB MAR etc.
2022 1016 483 608 --315 487 --284 164 477 75 --126 --177 752
2023 958 178 417 162 --178 183 204 292 --33 --231 675 --762
2024 66 --177 412 70 --331 --9 64 206 377 --346 --273 478
2025 2234 --588 201 436
Last 12 months: 204k/month average
January and February of each year are affected by changes in population controls.
A very volatile data series from month to month. I used a double minus to make the negative ones stand out a little better
This Household Survey also produces the unemployment rate and labor force participation rate among many other stats
REVISIONS of the prior 2 months: down 58,000, from the BLS news release:
https://www.bls.gov/news.release/empsit.nr0.htm
So compared to the report that came out one month ago we have 177,000 - 58,000 = 119,000 net new payroll jobs reported.
###############################################################
###############################################################
LINKS to some BLS Data Series Numbers and Graphs
Table A - Summary of Household Survey (produces unemployment rate, labor force participation rate) - https://www.bls.gov/news.release/empsit.a.htm
Table B - Summary of Establishment Survey (produces the headline payroll jobs number and the average earnings) - https://www.bls.gov/news.release/empsit.b.htm
Every one of these data series comes with a table and graph:
# Nonfarm Employment (Establishment Survey, https://data.bls.gov/timeseries/CES0000000001
Monthly changes (in thousands): https://data.bls.gov/timeseries/CES0000000001?output_view=net_1mth
NOT SEASONALLY ADJUSTED: https://data.bls.gov/timeseries/CEU0000000001
# Employed in thousands from the separate Household Survey, http://data.bls.gov/timeseries/LNS12000000
Monthly changes (in thousands): http://data.bls.gov/timeseries/LNS12000000?output_view=net_1mth
NOT SEASONALLY ADJUSTED: https://data.bls.gov/timeseries/LNU02000000
# Nonfarm PRIVATE Employment (Establishment Survey, https://data.bls.gov/timeseries/CES0500000001
Monthly changes: https://data.bls.gov/timeseries/CES0500000001?output_view=net_1mth
^-Good for comparison to the ADP report that typically comes out a few days earlier
NOT SEASONALLY ADJUSTED: https://data.bls.gov/timeseries/CEU0500000001
Earnings of Production and Non-Supervisor Workers (PANSW)
. . . # INFLATION ADJUSTED Hourly Earnings of PANSW http://data.bls.gov/timeseries/CES0500000032
. . . # INFLATION ADJUSTED Weekly Earnings of PANSW http://data.bls.gov/timeseries/CES0500000031
----- Nominal means NOT inflation adjusted. Just plain ordinary greenbacks ----
. . . # Nominal Hourly Earnings of PANSW- http://data.bls.gov/timeseries/CES0500000008
. . . # Nominal Weekly Earnings of PANSW - http://data.bls.gov/timeseries/CES0500000030
# Labor Force http://data.bls.gov/timeseries/LNS11000000?output_view=net_1mth
The labor force is the sum of employed and unemployed. To count as unemployed, one must have actively sought work in the past 4 weeks (just looking at want ads and job postings doesn't count)
# ETPR (Employment-To-Population Ratio) aka Employment Rate http://data.bls.gov/timeseries/LNS12300000
# LFPR (Labor Force Participation rate) http://data.bls.gov/timeseries/LNS11300000
Unemployed, Unemployment Rate
# Unemployed http://data.bls.gov/timeseries/LNS13000000
# Unemployment rate http://data.bls.gov/timeseries/LNS14000000
# Black unemployment rate (%), https://data.bls.gov/timeseries/LNS14000006
# Hispanic or Latino unemployment rate (%), https://data.bls.gov/timeseries/LNS14000009
# White unemployment rate (%), https://data.bls.gov/timeseries/LNS14000003
# U-6 unemployment rate http://data.bls.gov/timeseries/LNS13327709
# Long term unemployed 27 weeks or longer as a percent of total unemployed http://data.bls.gov/timeseries/LNS13025703
------------ end unemployed, unemployment rates --------
# NILF -- Not in Labor Force http://data.bls.gov/timeseries/LNS15000000
# NILF-WJ -- Not in Labor Force, Wants Job http://data.bls.gov/timeseries/LNS15026639
# Part-Time Workers who want Full-Time Jobs (Table A-8's Part-Time For Economic Reasons) http://data.bls.gov/timeseries/LNS12032194
# Part-Time Workers (Table A-9) http://data.bls.gov/timeseries/LNS12600000
# Full-Time Workers (Table A-9) http://data.bls.gov/timeseries/LNS12500000
# Multiple Job holders (Table A-9) - http://data.bls.gov/timeseries/LNS12026619
# Multiple Jobholders as a Percent of Employed (Table A-9) https://data.bls.gov/timeseries/LNS12026620
# Civilian non-institutional population
Seasonally adjusted (they seem to have gotten rid of this) https://data.bls.gov/timeseries/LNS10000000
NOT seasonally adjusted: https://data.bls.gov/timeseries/LNU00000000
. . In Table A-1 https://www.bls.gov/news.release/empsit.t01.htm they show the same numbers for seasonally adjusted and non-seasonally adjusted
LFPR - Labor Force Participation Rate for some age groups
The LFPR is the Employed + jobless people who have looked for work in the last 4 weeks (and say they want a job and are able to take one if offered. Looking for work involves more than just looking at job listings). All divided by the civilian non-institutional population age 16+ (in the case of the regular LFPR, or divided by the civilian non-institutional population of whatever age, gender, race etc. for the various sub-demographic measures. For example. the LFPR of age 25-54 females is the number of those employed or actively seeking work divided by the civilian non-institutional population of age 25-54 females.)
SA means Seasonally adjusted. NSA means Not Seasonally Adjusted
16+: SA: http://data.bls.gov/timeseries/LNS11300000 NSA: http://data.bls.gov/timeseries/LNU01300000
25-34: SA: http://data.bls.gov/timeseries/LNS11300089 NSA: http://data.bls.gov/timeseries/LNU01300089
25-54 ("Prime Age" ): SA: http://data.bls.gov/timeseries/LNS11300060 NSA: http://data.bls.gov/timeseries/LNU01300060
55-64: -------------------- NSA: https://data.bls.gov/timeseries/LNU01300095
55+: SA: http://data.bls.gov/timeseries/LNS11324230 NSA: http://data.bls.gov/timeseries/LNU01324230
65+: SA: ---------------- NSA: http://data.bls.gov/timeseries/LNU01300097
LFPR - Labor Force Particpation Rate (prime age 25-54) by gender
All: http://data.bls.gov/timeseries/LNS11300060
Men: http://data.bls.gov/timeseries/LNS11300061
Women: http://data.bls.gov/timeseries/LNS11300062
More LFPR links including by race: https://www.democraticunderground.com/111695870
ETPR - Employment to Population Ratio for some age groups
SA means Seasonally adjusted. NSA means Not Seasonally Adjusted
16+: SA: http://data.bls.gov/timeseries/LNS12300000 NSA: http://data.bls.gov/timeseries/LNU02300000
25-34: http://data.bls.gov/timeseries/LNS12300089 NSA: http://data.bls.gov/timeseries/LNU02300089
25-54 ("Prime Age" ): SA: http://data.bls.gov/timeseries/LNS12300060 NSA: http://data.bls.gov/timeseries/LNU02300060
55-64: SA: ---------------- NSA: https://data.bls.gov/timeseries/LNU02300095
55+: SA: http://data.bls.gov/timeseries/LNS12324230 NSA: http://data.bls.gov/timeseries/LNU02324230
65+: SA: ---------------- NSA: http://data.bls.gov/timeseries/LNU02300097
Data series finder (employment/unemployment related): https://www.bls.gov/data/#employment
The entire report: http://www.bls.gov/news.release/pdf/empsit.pdf
Inflation rate (CPI)
. . . Monthly report: https://www.bls.gov/news.release/cpi.nr0.htm
. . . Regular CPI: https://data.bls.gov/timeseries/CUSR0000SA0?output_view=pct_1mth
. . . Core CPI: http://data.bls.gov/timeseries/CUSR0000SA0L1E?output_view=pct_1mth
. . . Energy: https://data.bls.gov/timeseries/CUSR0000SA0E?output_view=pct_1mth
. . . Food: https://data.bls.gov/timeseries/CUSR0000SAF1?output_view=pct_1mth
. . . Food at home (groceries): https://data.bls.gov/timeseries/CUSR0000SAF11?output_view=pct_1mth
. . . Calculator at: https://www.bls.gov/data/inflation_calculator.htm
. . . One Screen Data Search for CPI components: https://data.bls.gov/PDQWeb/cu
Grocery prices (food at home) inflation compared to overall inflation rate
. . . . . https://www.in2013dollars.com/Food-at-home/price-inflation
. . . From 1947 to 2021 and from 2000 to 2021, food at home inflation very slightly lagged the overall inflation rate
. . . . . https://www.democraticunderground.com/10142735789
Archives of previous reports - The monthly payroll employment reports from the BLS are archived at Archived News Releases (https://www.bls.gov/bls/news-release/ ). In the list up at the top, under Major Economic Indicators, select Employment Situation ( https://www.bls.gov/bls/news-release/empsit.htm ). That opens up links to reports going back to 1994.

FredGarvin
(627 posts)Wall Street is celebrating as are IRA and 401K investors.
Hopefully this keeps up.
DallasNE
(7,769 posts)Some statistical issues impact the results. For instance, March job gains were reduced downwards by 43,000 jobs and a reminder that a large number of government workers fired are getting severance pay so they count as employed until the severance runs out.
Let’s see what Challenger, Gray and Christmas report on Monday on job cut announcements. That is forward looking so it deserves to be watched.
mahatmakanejeeves
(64,512 posts)
Grins
(8,320 posts)Especially after what the mango demagogue said about the Commerce Department report showing GDP fell at a 0.3% annualized pace in Q1.
louis-t
(24,289 posts)I expect in a few months, the shit will hit the fan. Empty shelves, hoarding, foreclosures and job losses. It really is going to take the complete destruction of the economy to make a few people wake up.
progree
(11,853 posts)Last edited Fri May 2, 2025, 04:24 PM - Edit history (1)
March 2024 thru April 2025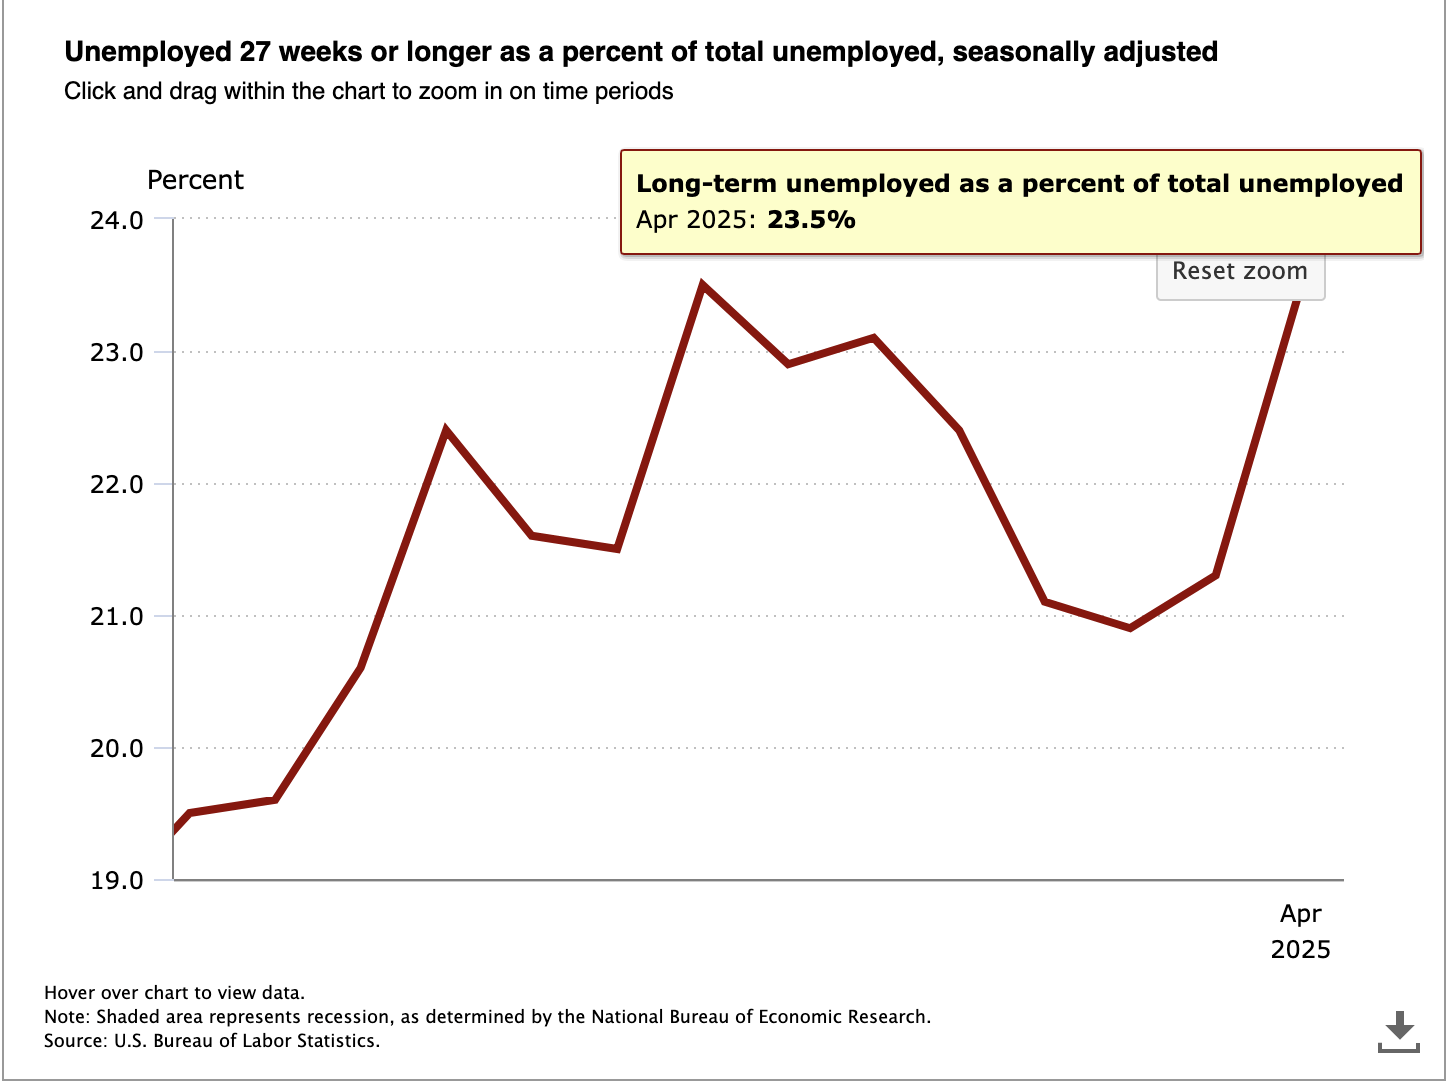
BLS data series (graph and table): http://data.bls.gov/timeseries/LNS13025703
The 23.5% is the highest it's been since April 2022, except for a tie with September 2024.